Your site needs one when main content takes longer than 2.5 seconds to appear, Core Web Vitals fail in Google Search Console, the admin dashboard drags, or sales drop with no clear cause. Two or more of these together mean it is time.
Most slow WordPress sites do not break overnight. They get heavier with every plugin and tracking script someone adds, until a page that loaded in 1.8 seconds two years ago now takes five. Nobody noticed the slide because each change felt small. A WordPress performance audit is how you find out what actually changed and which fixes will move the numbers.
If you already know your scores are in the red, our WordPress Core Web Vitals guide explains each metric and how to fix it. This post sits one step earlier. It covers the signs a WordPress site is slow enough to need a proper diagnosis, so you can decide whether to spend money on fixes or on finding the cause first.
For B2B WooCommerce stores, slowness often starts in a place speed plugins never touch: the sync between the store and the back office.
See How ERP Sync Affects Store Speed
Sign 1: Main Content Takes More Than 2.5 Seconds to Appear
Largest Contentful Paint (LCP) measures how long the biggest visible element, usually a hero image or the main product photo, takes to render. Google’s threshold for a good LCP is 2.5 seconds or less, measured at the 75th percentile of real visits.
If your homepage passes but category pages, product pages, or long blog posts sit at three or four seconds, that gap is a clue. It usually points to template-level problems: an unoptimized hero image loaded on every product, a slider that pulls ten images before the first one shows, or a page builder that wraps content in dozens of nested containers. A one-off image fix will not solve a template problem, which is why this sign calls for an audit before any quick tweak.
Sign 2: Core Web Vitals Are Failing in Google Search Console
PageSpeed Insights runs a lab test on one URL at one moment. Search Console shows field data from real Chrome users across groups of similar URLs. When the Core Web Vitals report in Search Console lists URLs as “Poor” or “Need improvement,” real visitors are getting a slow experience.
Pay attention to which metric fails. Poor LCP points to images, hosting, or render-blocking files. Poor Interaction to Next Paint (INP), where the target is 200 milliseconds or less, usually means heavy JavaScript from plugins, chat widgets, or tracking tags. Poor Cumulative Layout Shift (CLS), targeting 0.1 or less, often comes from ads, cookie banners, or images without set dimensions. The Core Web Vitals guide walks through fixes for each one, but an audit tells you which fix matters most on your specific templates.
Sign 3: The Admin Dashboard Is Slow Even When the Front End Feels Fine
Page caching hides a lot. Visitors get a stored HTML copy, so the public site can feel quick while the backend struggles. Your team feels it when saving a product takes eight seconds, the orders screen hangs, or search inside wp-admin times out.
A slow dashboard almost always traces back to the database. Years of post revisions, expired transients, orphaned metadata, and leftover tables from deleted plugins add weight to every query. The biggest offender is often autoloaded data in the wp_options table, which loads on every single request, cached or not. Our guide to WordPress database optimization covers what is safe to clean and what should only be touched by a developer. If your editors or sales staff complain about the backend, treat that complaint as data.
Sign 4: Server Response Time Is High Before Anything Loads
Time to First Byte (TTFB) is how long the browser waits before the server sends anything back. Google suggests aiming for 0.8 seconds or less. When TTFB is high, every other metric suffers, because nothing can render until that first byte arrives.
High TTFB has several possible causes: underpowered shared hosting, an outdated PHP version, no object caching, slow database queries, or a page that cannot be cached at all, such as a cart or a logged-in B2B account page. Checking TTFB on both a cached page and an uncached page tells you a lot. If cached pages are fast and uncached ones are slow, the problem lives in your code and database, not your host. A proper WordPress speed audit separates those two possibilities before you pay for a hosting upgrade you may not need.
Sign 5: Bounce Rate Rises and Conversions Drop With No Obvious Cause
Sometimes the first warning shows up in analytics, not in a speed tool. Traffic stays steady, but bounce rate on landing pages creeps up, add-to-cart rate falls, or quote form submissions slow down. The marketing team checks the ads and the copy and finds nothing different.
Speed is worth ruling out early in that situation. Compare page load timing in your analytics tool against the conversion trend over the same months. If the decline lines up with a theme update, a new plugin, or a new marketing script, you have a strong lead. Slow checkout steps hurt the most, because buyers who reach checkout already intend to purchase.
Sign 6: Nobody Knows What Half the Plugins Do
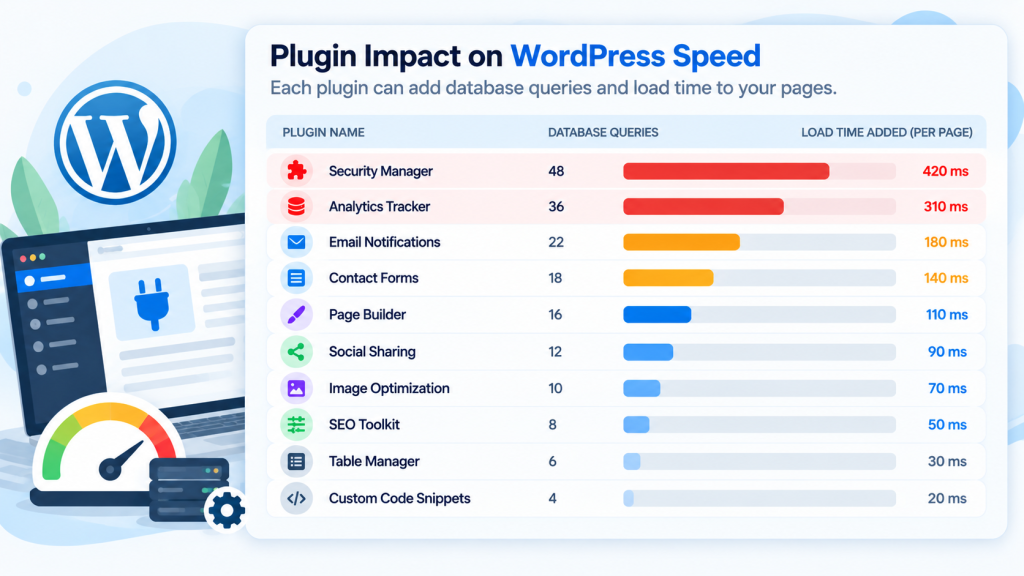
Plugin count alone does not make a site slow. Ten badly built plugins can do more damage than forty well-built ones. The real warning sign is when nobody on your team can explain why a plugin is installed, who added it, or whether anything still depends on it.
Every active plugin can add database queries, scripts, stylesheets, and scheduled tasks. Many load their assets on every page even when they are only used on one. An audit profiles each plugin’s actual cost using tools like Query Monitor, then sorts them into keep, replace, or remove. Our WordPress performance optimization guide explains the wider plugin problem in more depth, along with caching, images, and CDN setup.
Sign 7: Background Jobs and Integrations Keep Piling Up
General speed guides rarely cover this one, and it matters most for B2B WooCommerce stores. Many stores run constant background work: stock updates, price list imports, order exports, customer account syncs, and invoice status checks between WooCommerce and an ERP, CRM, or warehouse system.
When that sync is built poorly, it competes with real shoppers for server resources. You may see thousands of pending or failed jobs under WooCommerce > Status > Scheduled Actions, WP-Cron events firing every minute, or full catalog re-syncs running during business hours. Shoppers feel the slowdown in waves, often at the same time each day, and page caching cannot help because the load comes from jobs running on the server.
An audit should map every integration, how often it runs, how much data it moves, and whether it updates only what changed or rewrites everything. On stores with heavy sync traffic, fixing the sync can speed things up more than front-end tweaks, and it also cuts down the stock and pricing mismatches that bad syncs cause
Review Your WooCommerce ERP Integration
Sign 8: The Site Slows Down or Fails During Traffic Spikes
A site that performs fine on a normal Tuesday and falls over during a product launch, a trade show campaign, or a holiday sale has a capacity problem. The usual symptoms are 502 or 504 errors, checkout timeouts, or “Error establishing a database connection” messages.
Under heavy traffic, the weak points that normal days hide start to show: pages that bypass the cache, uncached AJAX requests from cart fragments or live search, and database tables without the right indexes. Load testing is part of a full audit for this reason. Finding the breaking point on a staging copy costs far less than finding it during your biggest sales week of the year.
Sign 9: Mobile Scores Are Far Worse Than Desktop
Don’t dismiss a PageSpeed result of 90 on desktop and 40 on mobile. Google uses mobile-first indexing, so Google ranks your pages based on how the mobile version performs.
Large mobile gaps usually come from oversized images served to small screens, heavy JavaScript that a mid-range phone processor struggles to run, and third-party scripts that load before the content. These are signs the WordPress site is slow for the visitors who matter most, even if it feels fine on the office computer.
Sign 10: It Has Been More Than a Year Since Your Last Audit
Some sites need an audit even with no visible symptoms. If your last review was over 12 months ago, or if the site recently went through a redesign, a CMS migration, a PHP version upgrade, a new theme, or a large product import, the baseline you measured before no longer applies.
Waiting for rankings to drop before checking is the expensive path. A scheduled audit catches regressions while they are still small.
The short answer to when to audit WordPress performance: run a full audit once a year, and run a targeted one after any major change. A lighter monthly check of Search Console and a few key pages keeps you from being surprised.
| Trigger |
Audit type |
Why |
| Two or more signs from this list |
Full audit |
Several symptoms together usually share a root cause. |
| Redesign, migration, or new theme |
Full audit |
Templates and asset loading change completely. |
| PHP or WordPress core major upgrade |
Targeted audit |
Plugin compatibility and query behavior can shift |
| New ERP, CRM, or inventory integration |
Targeted audit |
Background sync load is new and untested. |
| Before a planned traffic spike |
Load test plus targeted audit |
Find capacity limits on staging first. |
| No changes, no symptoms |
Annual full audit |
Catch gradual slowdowns early. |
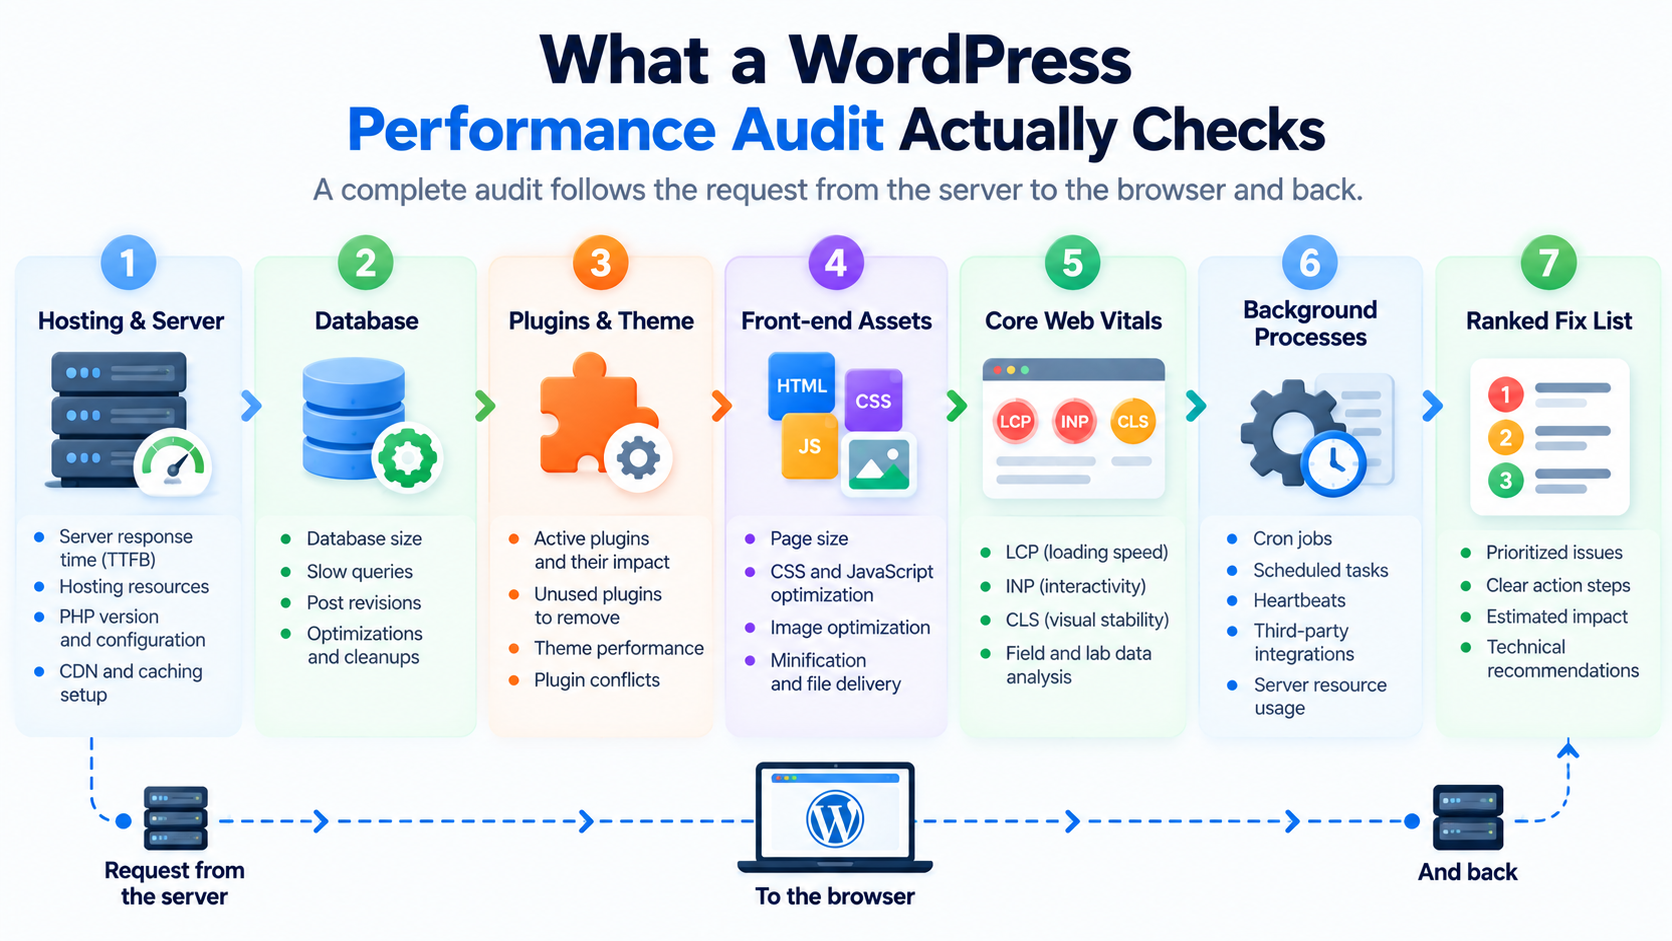
A useful audit goes deeper than a PageSpeed score. It should cover the full request path, from server to browser:
- Hosting and server: PHP version, available memory, object caching, and TTFB on cached and uncached pages
- Database: table sizes, autoloaded options, slow queries, missing indexes, and leftover plugin data
- Plugins and theme: query count, scripts, and stylesheets added by each one, measured per template
- Front-end assets: image sizes and formats, render-blocking CSS and JavaScript, font loading
- Third-party scripts: analytics, chat, ad, and marketing tags, and when each one loads
- Background processes: WP-Cron, Action Scheduler queues, and integration sync frequency
- Real-user data: Search Console Core Web Vitals and analytics timing, compared against lab tests
The output should be a ranked list of fixes, each with its expected effect on load time or Core Web Vitals. For a closer look at how DazzleBirds structures this diagnostic work, see the WordPress speed optimization solution page.
How to Run a Quick WordPress Speed Audit Yourself
Before hiring anyone, you can run a basic WordPress speed audit in about an hour:
- Open the Core Web Vitals report in Google Search Console and note which URL groups fail and on which metric.
- Test your homepage, one category page, one product or service page, and one blog post in PageSpeed Insights. Record mobile LCP, INP, CLS, and TTFB for each.
- Install Query Monitor on a staging copy and load your slowest page. Note the total query count and any query taking longer than 0.05 seconds.
- Check WooCommerce > Status > Scheduled Actions for large numbers of pending or failed jobs.
- List every active plugin with its purpose and owner. Flag any plugin nobody can explain.
- Compare results with the ten signs above.
If this quick pass turns up two or more problems, or the causes are not obvious, a full WordPress performance audit with profiling and load testing is the right next step. The WordPress performance optimization guide is a good reference for the fixes that usually follow.
Find the Cause Before You Pay for Fixes
Speed problems rarely have one cause. Images, database bloat, plugin weight, hosting limits, and background sync often stack on top of each other, and fixing the wrong one first wastes budget. An audit gives you the order of operations.
For B2B WooCommerce stores, check the integration layer early. If stock, pricing, and order data move between WooCommerce and your ERP through heavy, poorly scheduled syncs, shoppers get a slower site and your team gets less reliable data. DazzleBirds builds WooCommerce ERP integrations that send only changed records and schedule heavy jobs outside peak hours, with failure handling that keeps the queue from flooding.
Talk to Us About Your WooCommerce ERP Integration
FAQs
A WordPress performance audit is a structured review of everything that affects how fast a site loads and responds: hosting, database, plugins, theme, front-end assets, third-party scripts, and background jobs. It ends with a ranked list of fixes based on measured impact.
For most businesses, the answer to when to audit WordPress performance is once a year as a baseline, plus a targeted audit after a redesign, migration, PHP upgrade, new theme, or new ERP or CRM integration. Audit sooner if two or more warning signs appear together.
A quick self-check takes about an hour. A professional WordPress speed audit on a business site usually takes a few days, depending on the number of templates, plugins, and integrations, and whether load testing is included.
The audit finds and ranks the causes of slowness. Optimization is the work of fixing them. Running an audit first stops you from spending the budget on fixes that do not address the real bottleneck.
Yes. Syncs that re-import the full catalog, run every minute, or retry failed jobs without limits compete with shoppers for server resources. A well-built integration updates only changed records and runs heavy jobs outside peak hours.
You can spot most warning signs yourself with Search Console, PageSpeed Insights, and Query Monitor. Database profiling, load testing, and integration reviews usually need a developer, especially on WooCommerce stores with custom code.


 WooCommerce Solutions
 Solutions for WordPress